Power
ENERGY.SLE — forecasting and optimising the field's power consumption
We forecast the load by well stock and facilities, remove grid overloads and cut electricity costs.
ENERGY.SLEA module of the Solution Line Engineering ecosystem: it runs on the single asset model together with the other solutions and is linked to them by one data chain.About the digital twin →
Problem
Electricity is one of the largest OPEX items in production. Simultaneous start-ups of intermittent wells create peaks and overload transformer substations, the energy-efficiency potential is invisible in metering reports, and associated gas burns at the flare.
Solution
ENERGY.SLE sees the load of the whole grid — from the main substation to the well pad transformers — knows the start-up schedule and forecasts consumption 30 days ahead. The solution shifts start-up schedules to remove the peak without losing production, keeps a register of measures and accounts for own generation on associated gas.
What the solution sees
One storyline at the demonstration field
STEP 01
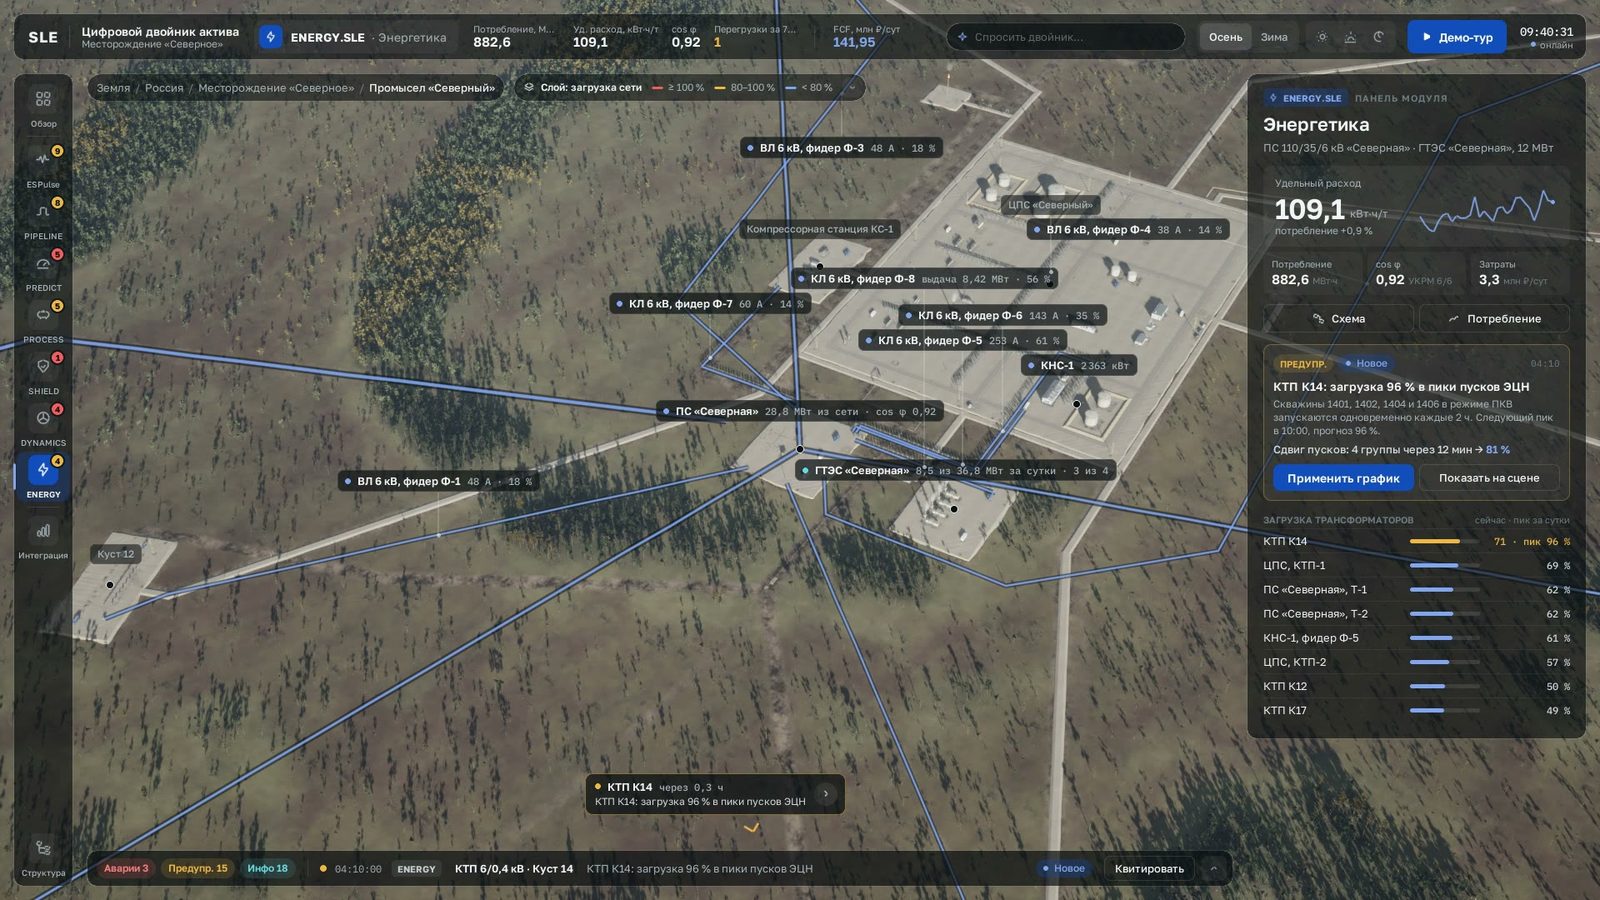
Load of the whole grid
Almost everything runs with margin, but the pad 14 substation is loaded almost to the limit during well start-ups: 71%, peaks up to 96%.
STEP 02
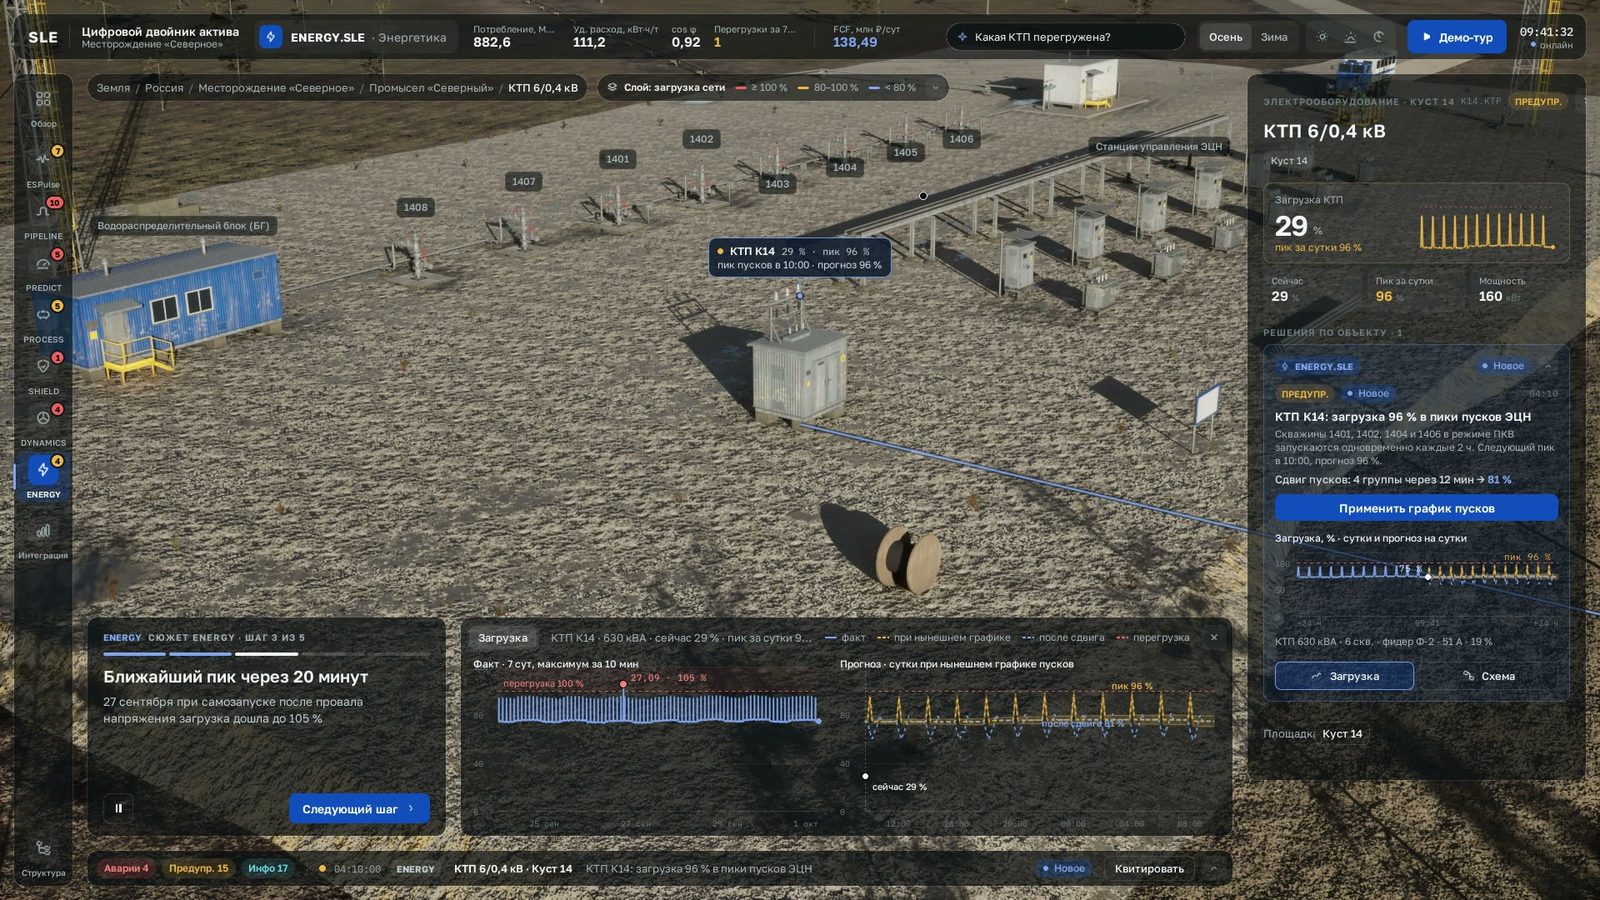
Next peak in 20 minutes
Four intermittent wells start at the same time and the inrush currents add up. On 27 September, during an auto-restart, the load reached 105%.
STEP 03
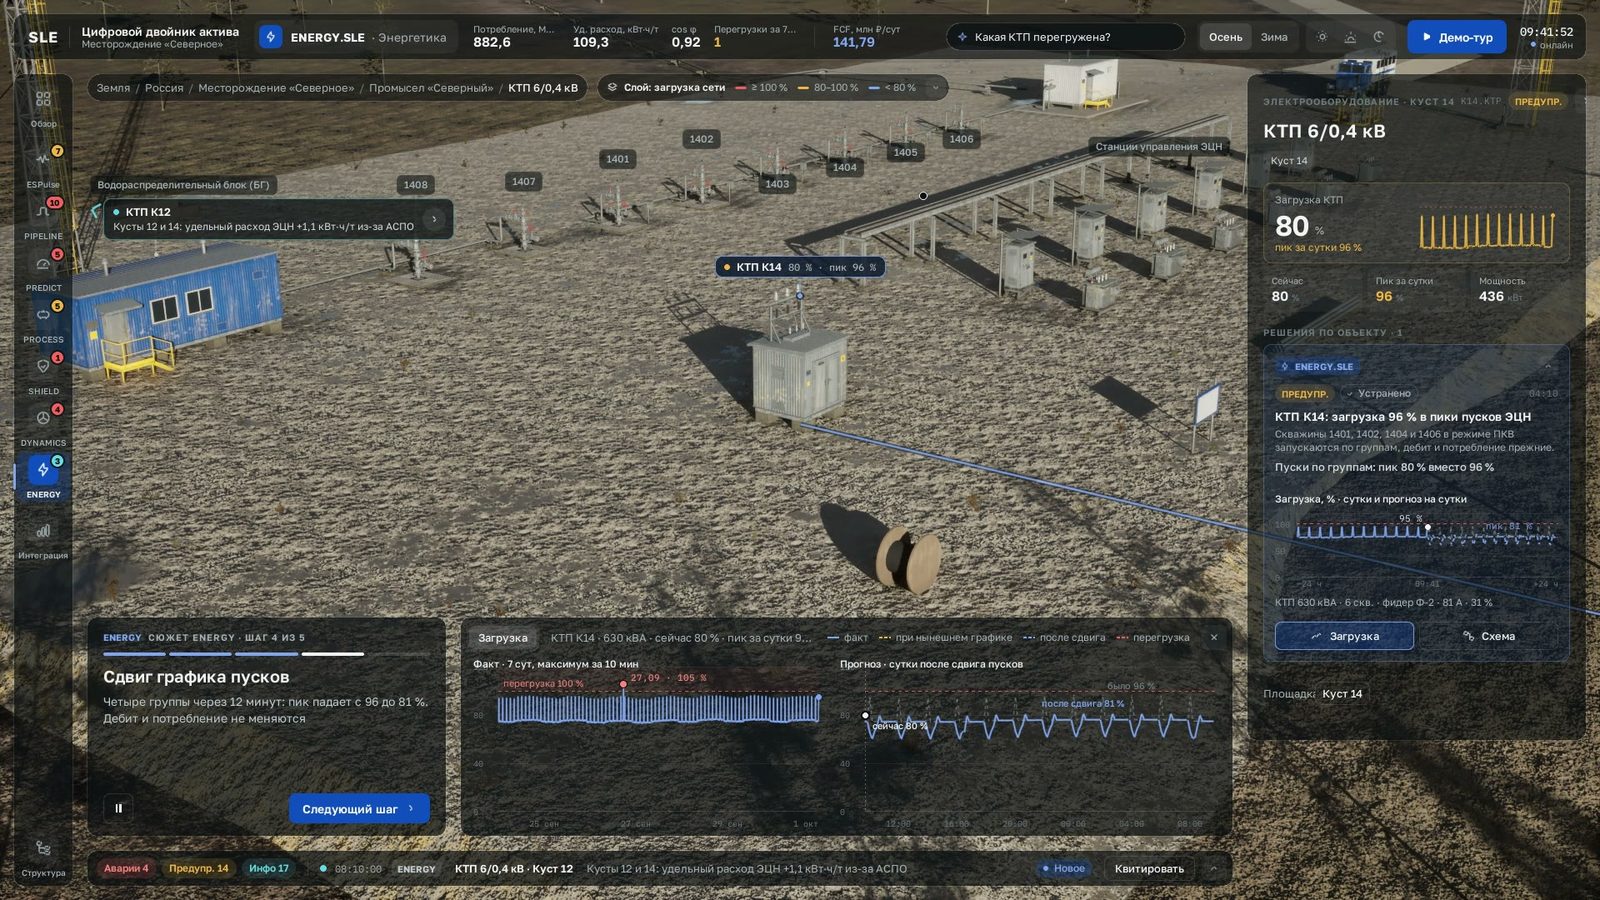
Shifting the start-up schedule
Four groups 12 minutes apart: the peak drops from 96 to 81%, production and consumption stay the same. The power plant takes the gas that used to go to the flare.
Ask the twin
“Which transformer substation is overloaded?”
Pad 14 transformer substation: at ESP start-up peaks the load reaches 96% of 630 kVA, now 71%. Shifting start-ups into four groups will cut the peak to 81%.
An answer with sources; the “Show on scene” button flies the camera to the object.
How it works
01DataEnergy metering, well modes, grid diagram
02ModelTransformer and line loading, cos φ
03Forecast30-day consumption by well stock and facilities
04SolutionStart-up shift, reactive power, generation
05ControlEffect of measures from metering data
Capabilities
Grid load
Transformers and lines with a pulsing power flow; 7-day overloads in the header.
Start-up schedule
Next peak in 20 minutes: four intermittent wells start simultaneously.
Schedule shift
Four groups 12 minutes apart — the peak drops from 96 to 81%, production unchanged.
Consumption forecast
Actual and 30-day forecast, breakdown by process.
Specific consumption
kWh per tonne for the field and per facility.
Own generation
Associated gas power plant: 8.5 MW out of 36.8 — gas instead of flaring.
Reactive power
Optimal distribution across the grid, cos φ per facility.
Register of measures
Statuses, expected and confirmed effect.
Business effect
−4%
electricity costs in production over 6 months of pilot operation
case · ESP wells on intermittent operation
96 → 81%
substation peak load after the start-up shift
demonstration on the twin
8.5 MW
own generation on associated gas
demonstration on the twin
Case figures were obtained in pilot operation and deployments at specific facilities; “demonstration on the twin” values come from the storyline at the model field.
Use cases
- Chief power engineer sees a substation with a 96% peak and a recommendation to shift the intermittent schedule into four groups with an 81% forecast.
- Field power engineer plans reactive power compensation measures with a calculated effect.
- Artificial lift engineer balances intermittent operation modes together with the power engineer — the link with ESPulse.SLE.
Integrations
Metering and energy accounting systems, ESP controllers and DCS, grid diagrams; ESPulse.SLE for specific consumption of the well stock, DYNAMICS.SLE for unit consumption.
Cross-cutting chains
- ESPulse.SLE — Start-ups of intermittent wells
- DYNAMICS.SLE — Pump wear and feeder power
- PROCESS.SLE — Separator gas to generation
- Article: what an asset digital twin is and where to start →
We will show ENERGY.SLE on your asset's data
A demo online or on site; then a pre-project survey of one facility and pilot operation with a measured effect.