What an asset digital twin is
A digital twin is a model of a real object that continuously receives data from that object and returns calculated conclusions: a forecast, a recommendation, an estimate of the effect. All three words in "asset digital twin" matter.
- Digital — the model is built on data, not drawings: telemetry, lab analyses, repair history, operating modes.
- Twin — the model reproduces the behaviour of the object, not just its appearance. If line pressure at the well pads has gone up, the twin knows why and calculates how much oil is lost because of it.
- Asset — not a single pump or well but the production asset as a whole: from the well through the gathering system, treatment and injection to custody transfer of marketable oil, and the power supply of all of it.
How an asset twin differs from similar things:
- From a 3D model or BIM. Geometry without data shows how the object is built, not how it works now or what will happen to it tomorrow.
- From a "digital shadow". A shadow receives data from the object but calculates nothing and recommends nothing. The link is one-way.
- From SCADA and dashboards. They show the actual state. A twin compares actual with calculated, answers "what will happen" and "what to do", and counts the effect in tonnes and money.
What a twin consists of
Whatever the industry or the vendor, a working asset twin has five parts.
- Asset model. One register of objects and links: well pads, wells, nodes and sections of the gathering network, vessels of the central processing facility, pump stations, substations and lines. Every object has a class, a parent and a position on the model. A pipeline is described by sections with a linear coordinate — "section, from and to" — so that a wax zone, a leak location and a wall-thickness profile all sit on the same axis.
- Telemetry and time series. Data on three time scales: seconds for a leak, days for pump wear, years for corrosion. Plus forecast series with an uncertainty corridor.
- Calculation models. Network hydraulics, a treatment process model, a unit condition index, electrical grid loading. This is the part that turns data into conclusions.
- Findings log. A forecast, an anomaly, an event and a recommendation are one entity with an author, a status and an action: new, under review, confirmed, false, resolved. A finding stores the object, the module and the moment in time, so you can return to it in one click.
- Levers and effects. What can be controlled — pigging, chemical dosing, start-up schedule, section replacement — and how it changes production, costs and risks. Effects add up into a cross-cutting value chain all the way to free cash flow.
One object — several views
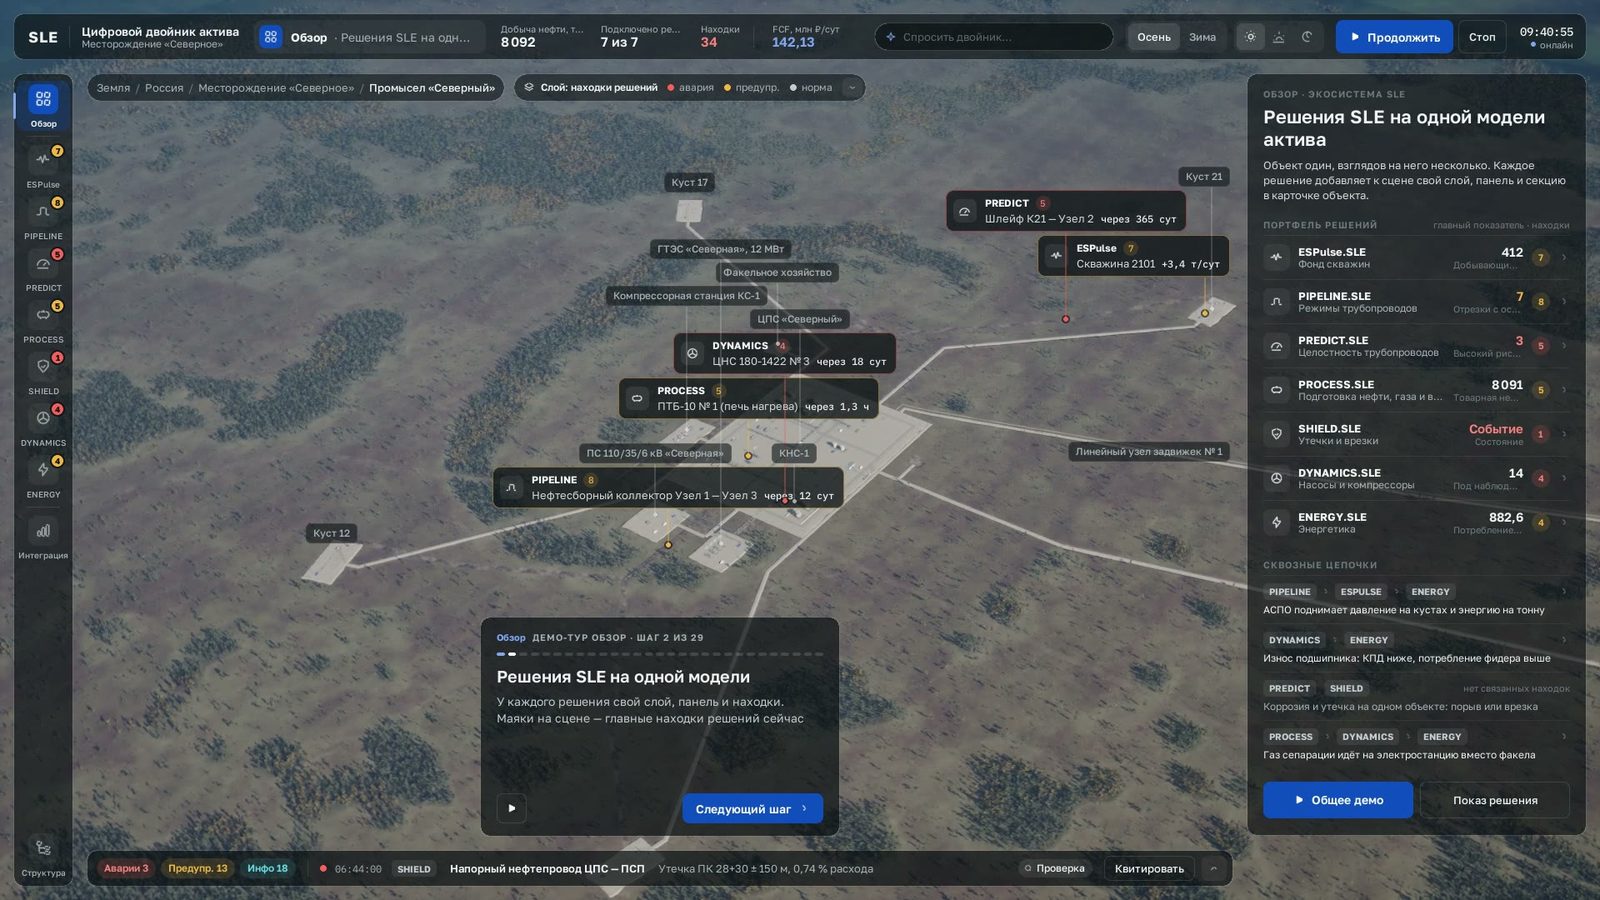
The main argument for a twin of the whole asset rather than a set of separate systems is cross-cutting effects. The same pipe section is a flow complication and a pressure drop for the transport engineer, a corrosion rate and remaining life for the integrity engineer, an inlet–outlet balance for the security service, and the energy the pads spend on back-pressure for the power engineer. Separate screens cannot show this; on one model it is one object card with several sections.
Chains that are visible only on a shared model:
- Wax deposits in a trunk line raise line pressure at the pads. Wells produce less oil and spend more electricity per tonne.
- Bearing wear in a cluster pump station pump lowers its efficiency. Feeder consumption rises, injection falls.
- Pipe corrosion and a leak belong to the same object. Two views in one card help tell a rupture from an illegal tap.
- Separator gas goes through the compressor to the field's own power plant instead of the flare.
Three navigation axes: place, solution, time
The state of the twin's screen is set by three independent choices.
- Place. Field → oilfield → site → object → unit → component. Full 3D inside the detailed zone, markers and lines on satellite imagery for the rest of the licence area.
- Solution. Which module to look at the asset through: well stock, pipeline operating modes, integrity, leaks, treatment, pumps and compressors, power. A module switches on its own scene layer, its own panel and its own views.
- Time. Now, history or forecast horizon: the network in a year without repairs and with a repair programme, substation load in twenty minutes, hydrate margin by the morning.
A finding in the log stores all three coordinates, so you can return to it from the log in one action: the right module, object and view open up.
What data a digital twin needs
A twin does not need perfect data, but it does need an honest answer about which data exists.
- Records and diagrams. An object register, pipe diameters and route profiles, vessels and their records, a single-line diagram of the power supply.
- Telemetry. Pressures, flows, temperatures, bearing vibration and temperatures, currents and voltages — from the DCS, ESP controllers and energy metering systems.
- Laboratory and inspection. Compositions and water cut, in-line inspection and ultrasonic thickness measurement, corrosion monitoring, rupture and repair history.
- Modes and schedules. Start-up schedules of intermittent wells, pigging plans, maintenance schedules.
If data is scarce, the twin still starts with what exists: gaps become visible on the model immediately and turn into a plan for sensors and integrations. The quality of a series matters more than its volume: one reliable pressure sensor at a node is worth more than ten that nobody trusts.
Where to start implementing a digital twin: six steps
- One object and one pain. A trunk line with deposits, a substation overloaded during start-ups, a pump with rising vibration, a heater running short. Not a "twin of everything" but an object where the effect can be counted.
- Asset model. A register of objects and links for this object and its surroundings: where the product comes from, where it goes, what powers it.
- Data. Connect telemetry, collect history, assess the quality of the series. This is also where missing sensors become obvious.
- Two or three modules on one model. For example, pipeline operating modes, integrity and power for the gathering network. The first cross-cutting chain appears at this step already.
- Pilot operation with a measured effect. A baseline period, comparable conditions, factor analysis. The effect must be calculated before implementation and confirmed after it.
- Roll-out. The second object connects faster than the first: the data model, integrations and calculation models are shared.
A guide to timing: a pre-project survey takes two to four weeks, pilot operation six to twelve weeks.
Typical mistakes when implementing a digital twin
- Starting with a beautiful 3D picture without data and calculation. That is a presentation, not a twin.
- Building a "twin of the whole field" at once. The effect gets diluted and the project never ends.
- Setting up a separate system for every task without a shared asset model. Cross-cutting effects are lost and integrations are done several times over.
- Not appointing an owner. A recommendation without a person who accepts and applies it changes nothing.
- Not measuring the effect before the work starts. Afterwards it cannot be separated from the influence of other factors.
A use case of an asset digital twin at the field
A process engineer opens the pipeline operating modes module. In the table of gathering network sections the trunk line between nodes 1 and 3 is flagged as a section with wax deposits: the flow area is restricted by 34%, the pressure drop has grown from 0.16 to 0.43 MPa. The section card shows the consequence: line pressure at pads 12 and 14 is above normal, a shortfall of 14 tonnes of oil per day. The twin proposes pigging and calculates the expected effect.
The engineer schedules the pigging run from the same card. While the pig travels along the trunk line, the twin recalculates the restriction and the pressure drop, and after the run it compares the forecast with actual telemetry: a pressure drop of 0.03 MPa, a gain of 14 tonnes per day at the pads, and the finding moves to the "resolved" status. The effect enters the cross-cutting value chain as extra production.
In the same section card the integrity module shows the corrosion rate and the remaining life of the pipe, and the power module shows how much electricity the pads were spending on back-pressure before the run. This is what several views of one object means, with no switching between systems.
If a question is easier to ask in words, the twin's assistant answers from the same data: to "Why is pad 12 underproducing?" it names the cause, the section and the figures, and opens the object on the model.
Frequently asked questions about digital twins
No. The essence of a twin is data and calculation; a three-dimensional scene makes it understandable for a manager and convenient for an operator, but without data it remains an illustration.
A survey of one facility takes two to four weeks; pilot operation with a measured effect takes six to twelve weeks.
Yes. The twin and its modules run on-premise, on Linux and Windows, models are trained inside the customer's perimeter and data never leaves the company.
Predictive analytics for pumps, pipelines or power consumption are modules of the twin. The difference is the shared asset model and the cross-cutting effects between modules, which separate systems do not have.